A benchmark measures the path your tests take. A product is the path a person takes. Almost nothing I build has those two being the same thing, and the distance between them is where features go to quietly not exist.
I can put a number on it. On one Friday morning a bench told me my teach mode could draw a diagram, and it was telling the truth. Three and a half hours later the drawing reached a screen. In between were a day-old server, two routes sharing one lesson, a model thinking for four minutes in secret, and five separate places that each threw the picture away. Not one of them was visible to a test.
Sequence has a teach mode. You attach a repository, pick a level, ask it to teach you one file, and it answers with a lesson, a drawing of the part of the system you are looking at, and a question that checks you followed. Here is the day, with the real asks and the real screens.
One honesty note first. The screen reads below were done by an agent driving a browser and writing down what the screen showed and when, the way a tester would. I read its notes and the screens. The screens the product ships were captured by the repository itself from the running app.
The bench said yes
Across 188 turns of four benchmark reports, four produced a drawing, two refused, and 182 never attempted one: no tool call, no fenced block, no diagram in the prose. Three rewrites of the instructions had not moved it. So the drawing came out of the prompt and into code: when the turn’s concept names a real node in the scanned graph, the product builds the chart from the graph and the model writes the sentence beside it. Visual on substantive teaching turns went from 0 of 23 and 0 of 25 to 14 of 21 and 20 of 26. That was 12:42. I had a number.
The first seat: two minutes and thirteen seconds
At 14:41 the app was opened in a browser, Teach chosen from the mode menu, the level card I’ve used it picked, and the ask typed on Sequence’s own repository, 1,056 nodes: teach me how brief.ts works.
After 2 minutes 13 seconds: one round, one file read, a real prose lesson about renderBriefFromGraph and its helpers, a comprehension check and a closing question. No chart in the chat. The whiteboard said Nothing drawn yet. The session directory held a 64-byte chat file and no lesson file.
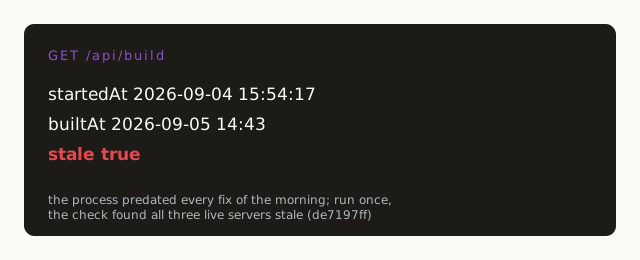
The server on that port had been started at 15:54 the day before. The code on disk had been rebuilt at 14:43 that afternoon. The process predated every fix of the morning, and nobody had noticed for a day because every measurement had run against a process someone started for the measurement. The server now reports when it started and when the file it loaded was built, and a check fails a running server older than its code. Run once before the restart, it found all three live servers stale.
Two handlers, one lesson, one narrowing
Underneath the stale process were two more reasons the seat could never have worked. The web client calls the streaming route, and that route had no lesson state at all: the concept queue, the lesson file and the derived chart all lived on the other route, which nothing drives. And the bench had been turning the model’s reasoning off while the product set nothing, so in the product the model thought for 8,388 to 14,731 hidden tokens a call, taking 134 to 262 seconds, where the same route with reasoning narrowed answered in 136 to 3,268 tokens in under four. Both routes now call one assembly of a teach turn.
The second seat: recorded, not rendered
At 15:08, server restarted, same ask: 54 seconds, five provider calls, answered from 211 of 2,591 edges. The lesson file was written. The chat showed a collapsed row, Drew a chart. The canvas showed its empty placeholder, and the canvas file held no blocks. The chart existed as a stream event and a chat row, and nowhere a person looks.
Two defects, one symptom. The client had never sent charts to disk: no charts field in the persisted shape, the serialiser did not send it, and a gate deciding whether the canvas was worth writing did not count a chart-only canvas. And the chart had already left the screen before any save, because the function that landed a turn’s canvas blocks rebuilt the whole document from scratch and wiped charts with it. The decisive observation was the tester’s: the placeholder appeared seconds after the turn, same browser session, no reload, so the chart could not have been in the store at all.
The third seat: the picture
At 15:51, both fixes in, the same ask: 41 seconds, five calls, four rounds. The reply ended with a check the product had built from the chart’s own links: Looking at the picture: if brief.ts changed what it returns, which of cli.ts, repoServer.ts or brief.test.ts do you think would break first? And on the canvas, with no reload, a chart titled brief.ts, captioned brief.ts and what it connects to, from the scanned graph.
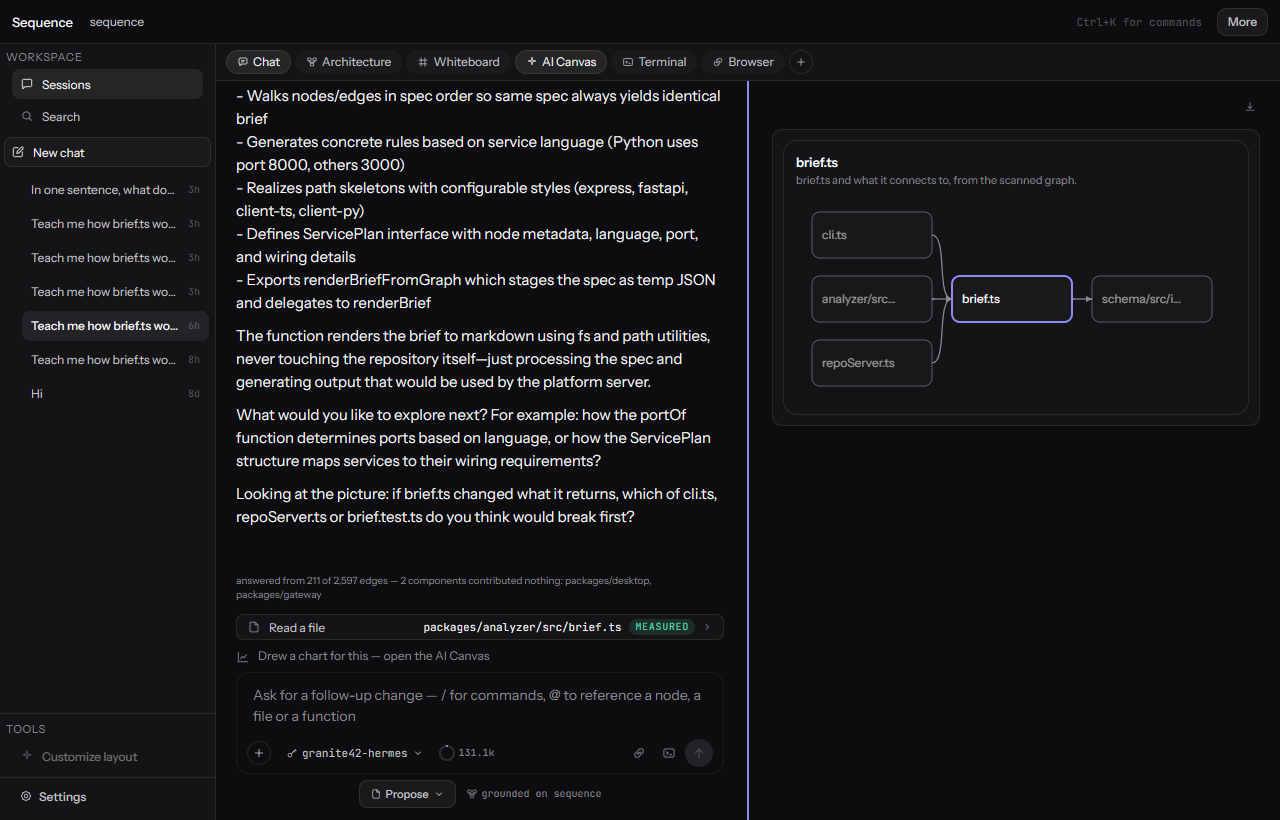
Checked against the source, every arrow was an edge the scan had recorded, direction right, nothing invented. It was still wrong twice, by construction of true facts. The inbound edges filled every slot and the one outbound edge was omitted, so the picture said the file depends on nothing; and the first outbound arrow, once drawn, read index.ts, a label twenty files in this repository share. Both were fixed the same hour, and the screen above is from after that fix, which is why it has an arrow going out.
A fifth importer was missing too, not from the chart but from the scan, which emitted no edge for a re-export. Fixing that took the repository from 2,600 edges to 2,851, one dependency in eleven, and gave twenty-two files that had looked unused their dependents. The chart was right about the scan, and the scan had been wrong about the repository in every dependency count the product had ever printed.
The fourth seat: reload
At 15:56 the page was reloaded and the lesson reopened from the session list. The placeholder again. The file still held the chart, written four minutes earlier. The load path had read it and thrown it away: a guard that treated a canvas with no blocks as empty; behind it, a hydrate latch that fired once per repository; and a store rule that only refused to overwrite when blocks existed. Five places, one picture, each looking complete on its own.
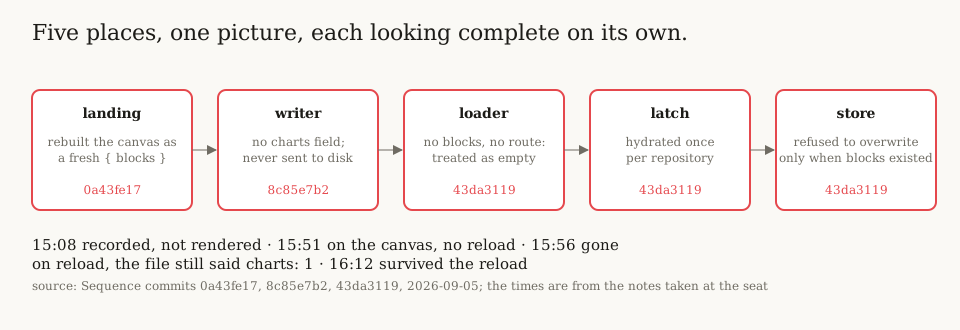
At 16:12 the server restarted with that fix: full reload, session reopened from the list, and the chart was there. Live path, persistence and restore all held.
What I think this means
A green test suite is a claim about the path the tests take, and nothing else. Every one of the five defects above sat outside that path. The suites were not weak; they were honest about a different thing than the one I cared about.
Sitting in the seat is the cheapest instrument I own. Four browser reads, roughly a minute of GPU each, produced five product defects and one scanner defect that had been corrupting every dependency count the product printed. Nothing else I ran that week came close to that rate.
Screens are evidence and they rot like evidence. The product now captures its own screens from the running app with no model call, each stamped with the build that made it, and refuses to capture from a server older than its code. A screenshot with no build behind it is exactly the claim the stale-server check exists to stop.
What I am not claiming is that the lesson is good. A second turn on the same thread still repeated the first for most of that week, because the syllabus only advanced on a turn that managed to ask a question, and long lessons stopped asking. That is a teaching defect and it is a different article. What this one says is narrower: the distance from 14 of 21 on the bench to one chart on one screen was a day-old process, two routes sharing one lesson, hidden reasoning and five places that each dropped the picture, and every single one was found by looking at the screen rather than at the number.
Sources
Commits in the Sequence repository, 2026-09-05, in the order the article uses them. Seat timings are from the notes taken at the time.
| commit | time | what it records |
|---|---|---|
4fc7ff9d |
10:01 | 188 turns: 4 visual, 2 refused, 182 never attempted |
155da648 |
12:10 | the chart built from the graph in code |
8896f8c4 |
12:42 | visual on substantive turns 14 of 21 and 20 of 26 against 0 of 23 and 0 of 25 |
ef4bf902 |
13:22 | the narrowing scoped to the teach turn |
64d302a2 |
13:55 | the streaming route had no lesson state |
df8a2f23 |
14:08 | both handlers call one assembly of a teach turn |
8a2013c9 |
14:33 | 136 to 3,268 tokens in 0.6 to 3.4 s, against 8,388 to 14,731 in 134 to 262 s |
de7197ff |
14:59 | the process started a day before the code; the build endpoint; three live servers stale |
18f585f8 |
15:12 | the check-in derived from the chart’s links |
8c85e7b2 |
15:17 | charts never sent to disk |
0a43fe17 |
15:30 | the landing rebuilt the canvas and wiped charts |
ff482f3c |
15:54 | the chart on the canvas without reload |
43da3119 |
16:00 | the load path: guard, latch, store rule; five places |
ba8c34c3 |
16:23 | a slot reserved per direction; twenty files named index.ts |
ecceb7a4 |
16:36 | a re-export is a dependency: 2,600 to 2,851 edges; 22 files |
1154115d |
17:10 | the screens and their build stamp, no model call |